Analysis of Saudi Market Performance: Broader Gains with Aramco at 23.98 SAR
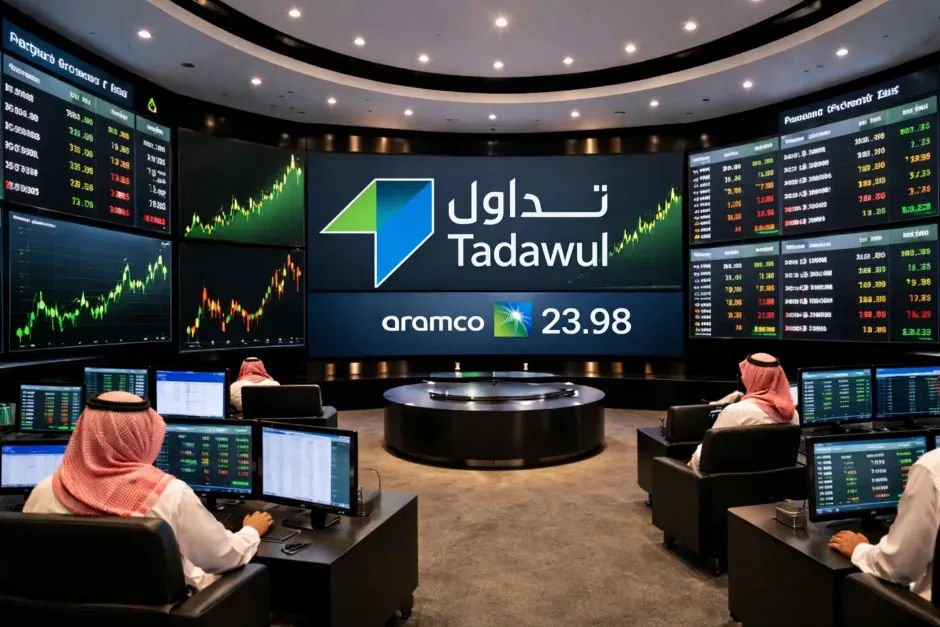
Saudi market rose broadly, led by blue-chip stocks like Aramco (23.98 SAR); liquidity focused on key sectors, while REITs lagged.
Riyadh | EcoPulse24
The Saudi stock market opened on a positive note across its main, parallel, and derivatives markets, signaling improved risk appetite and a concentration of liquidity in blue-chip and active stocks.
Market Index Performance:
- Main Market (TASI): 10,583.04 points (+1.05%)
- Nomu – Parallel Market: 23,595.85 points (+0.24%)
- Derivatives Market: 1,410.22 points (+0.93%)
- Sukuk & Bonds Market: 926.34 points (0.00%)
Top Stocks by Trading Value:
- Aramco: 23.98 SAR, 67,218,540.19 SAR
- Al Rajhi: 101.10 SAR, 65,773,719.15 SAR
- Al Ahli: 40.48 SAR, 47,015,557.90 SAR
- Tadawul Group: 144.10 SAR, 46,141,932.50 SAR
- Alinma: 25.52 SAR, 42,293,792.14 SAR
Most Actively Traded Stocks (by Volume):
- Americana: 1.66 SAR, 13,015,845 shares
- Export (Sadirat): 2.75 SAR, 12,989,904 shares
- Batic: 2.13 SAR, 6,796,882 shares
- Aramco: 23.98 SAR, 2,811,168 shares
- Maharah: 6.74 SAR, 2,414,453 shares
Top Gainers:
- Export (Sadirat): 2.75 SAR (+10.00%)
- Burgerizzr: 8.48 SAR (+8.86%)
- Saudi Re: 27.92 SAR (+6.32%)
- Bahri: 28.30 SAR (+5.91%)
- Azm: 23.45 SAR (+4.45%)
Top Losers:
- Alinma Retail REIT: 4.40 SAR (-3.08%)
- Alinma Hospitality REIT: 8.05 SAR (-2.90%)
- Al Yamamah Steel: 36.50 SAR (-1.51%)
- Red Sea: 29.56 SAR (-1.34%)
- Cenomi Centers: 18.77 SAR (-1.21%)
Analysis:
Overall, the Saudi market’s broader gains are supported by the general index and derivatives, with liquidity remaining focused on heavyweight stocks, particularly Aramco and the banking sector. In contrast, REIT funds showed negative divergence, suggesting a selective shift in liquidity rather than an exit from the market. This trend keeps the spotlight on blue-chip stocks and their ability to sustain gains in upcoming sessions.
Explore Related Coverage
Sources & References
Editorial Note
Disclaimer
© 2025 EcoPulse24. All rights reserved.