Dubai stocks edge higher to 5,878 as liquidity nears AED 900M, signaling steady institutional flows
Dubai stocks rose 0.28% to 5,878 as liquidity neared AED 900M, signaling steady institutional inflows and a controlled, stable uptrend.

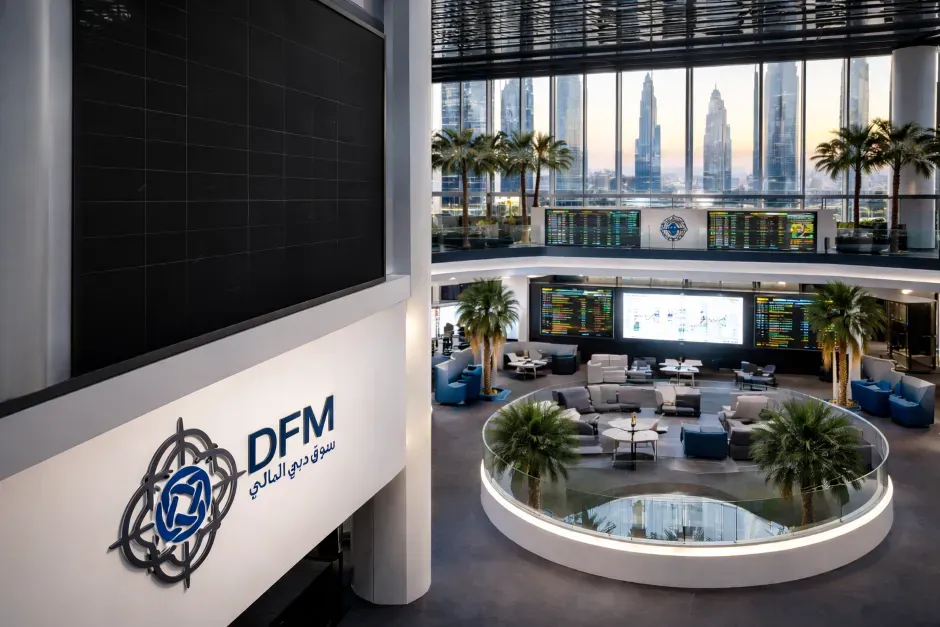
Dubai | EcoPulse24
DFM extends gains with controlled momentum and solid trading activity
Dubai Financial Market (DFM) closed modestly higher on April 21, with the benchmark DFMGI index rising to 5,878.28, up 0.28% (+16.17 points), as steady liquidity and balanced participation signaled continued institutional support despite the absence of aggressive buying momentum.
Trading activity remained robust, with total market turnover approaching AED 900 million, reflecting sustained interest in UAE equities amid a stable macro backdrop and ongoing capital rotation across key sectors.
DFM market snapshot
| Metric | Value |
|---|---|
| Index (DFMGI) | 5,878.28 |
| Change | +16.17 |
| Change (%) | +0.28% |
| Total Volume | 376.37 million shares |
| Total Value | AED 894.07 million |
| Total Trades | 19,808 |
The session reflects a continuation of gradual upward movement rather than a breakout rally, with liquidity levels suggesting selective positioning rather than broad-based speculative activity.
Liquidity approaching the AED 1 billion threshold is typically associated with institutional flows, particularly when accompanied by moderate index gains, indicating accumulation rather than short-term trading spikes.
Market structure and flow dynamics
The current pattern in DFM suggests a “controlled uptrend” environment:
-
Moderate index gains
-
Strong but not excessive liquidity
-
Stable trade count
-
Absence of volatility spikes
This combination often reflects positioning by longer-term capital rather than retail-driven momentum.
In such conditions, markets tend to build a base before attempting higher levels, especially when supported by macro stability and regional capital inflows.
Dubai Financial Market - Top Volume Data
| Company | Price | Change % | Change | Volume | Value |
|---|---|---|---|---|---|
| TALABAT | 0.859 | 0 | 0 | 84,085,365 | 72,284,536.98 |
| DSI | 0.25 | 4.167 | 0.01 | 56,929,956 | 14,207,089.15 |
| ITHMR | 0.216 | 5.882 | 0.012 | 52,191,525 | 11,322,548.41 |
| EMAAR | 12.68 | 0.316 | 0.04 | 30,371,893 | 385,332,230.06 |
| EKTTITAB | 0.466 | 14.778 | 0.06 | 19,098,603 | 8,693,908.61 |
Dubai Financial Market - Top Value Data
| Company | Price | Change % | Change | Volume | Value |
|---|---|---|---|---|---|
| EMAAR | 12.68 | 0.316 | 0.04 | 30,371,893 | 385,332,230.06 |
| EMIRATESNBD | 30.2 | 0 | 0 | 2,572,097 | 78,431,063.18 |
| TALABAT | 0.859 | 0 | 0 | 84,085,365 | 72,284,536.98 |
| AIRARABIA | 5.22 | -0.382 | -0.02 | 11,737,388 | 60,828,775.21 |
| EMAARDEV | 15.4 | 1.316 | 0.2 | 3,009,792 | 46,334,884.28 |
Dubai Financial Market - Top Gainers Data
| Company | Price | Change % | Change | Volume | Value |
|---|---|---|---|---|---|
| EKTTITAB | 0.466 | 14.778 | 0.06 | 19,098,603 | 8,693,908.61 |
| ALFIRDOUS | 0.306 | 14.179 | 0.038 | 17,361,355 | 5,187,890.57 |
| MKHZN | 1.67 | 7.742 | 0.12 | 70,827 | 116,780.9 |
| ITHMR | 0.216 | 5.882 | 0.012 | 52,191,525 | 11,322,548.41 |
| DSI | 0.25 | 4.167 | 0.01 | 56,929,956 | 14,207,089.15 |
Dubai Financial Market - Top Losers Data
| Company | Price | Change % | Change | Volume | Value |
|---|---|---|---|---|---|
| DNIR | 3.25 | -4.971 | -0.17 | 7,707 | 25,222.95 |
| NIH | 1.49 | -4.487 | -0.07 | 2,106 | 3,141.34 |
| TAKAFUL-EM | 1.55 | -3.727 | -0.06 | 638,885 | 1,016,532.59 |
| ALSALAMSUDAN | 0.57 | -3.226 | -0.019 | 203,900 | 116,687.36 |
| SUKOON | 4.9 | -2 | -0.1 | 9,000 | 44,100 |
EcoPulse24 Analysis
The key signal from today’s session is not the magnitude of the index move, but the quality of liquidity.
A near-AED 900 million turnover alongside a sub-0.3% gain indicates that capital is entering the market without chasing prices aggressively. This is typically characteristic of accumulation phases, where institutional investors build positions gradually.
This behavior aligns with broader regional dynamics, where Gulf markets are benefiting from:
-
Elevated oil revenues
-
Stable currency regimes
-
Increasing global investor allocation to the region
At the same time, the absence of sharp moves suggests that markets are still pricing in external uncertainties, particularly geopolitical developments linked to energy markets and global monetary policy.
From a structural perspective, DFM appears to be transitioning into a consolidation-driven uptrend, where price stability is supported by consistent inflows rather than speculative bursts.
The most important takeaway is this:
Liquidity is leading price - not the other way around.
This is a constructive signal. It indicates that the current move is being built on capital strength rather than sentiment alone.
If this pattern continues, the market is likely to test higher levels in a controlled manner, with reduced downside volatility compared to momentum-driven rallies.
In the broader UAE context, this reinforces the positioning of local equity markets as relatively stable destinations for capital, particularly in periods of global uncertainty.
The signal remains clear: Smart money is entering - quietly.
Explore Related Coverage
Sources & References
Editorial Note
Disclaimer
© 2025 EcoPulse24. All rights reserved.