Gold Caps 2025 With Strongest Rally Since Carter Era: The Year the ‘Safe Haven’ Became a Market Star
Gold surged 73% in 2025 to $4,561/oz, its best year since 1979, driven by central bank buying, weak dollar, and geopolitical tensions.

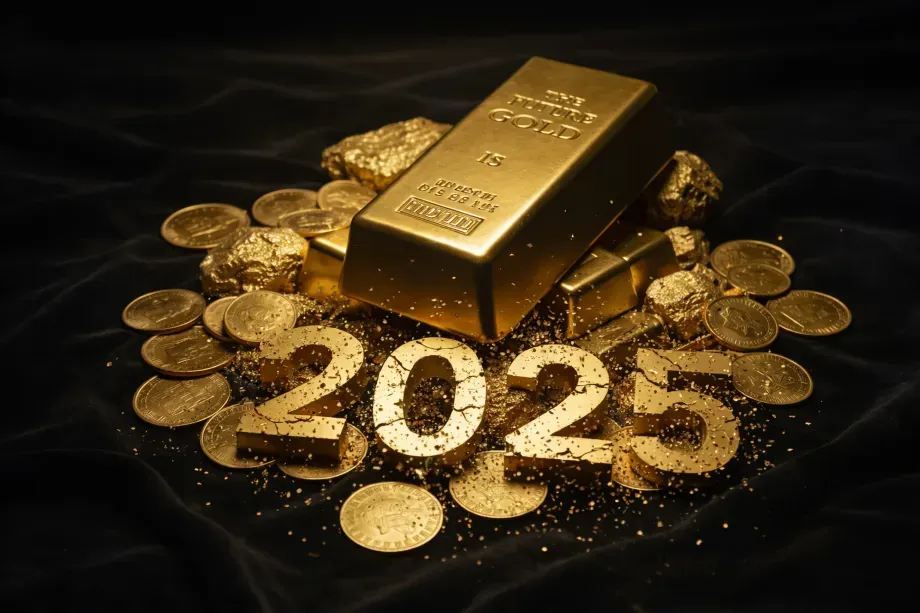
Bullion delivers best performance since 1979 with a 73% surge in 2025; Central bank buying, dollar weakness, and geopolitical volatility drive historic ascent.
While oil spent 2025 retreating into a bear market, gold soared to historic heights not seen since the presidency of Jimmy Carter in the late 1970s. Beginning the year at $2,640 per ounce, the precious metal is closing at a staggering level above $4,500 - a historic +73% jump that marks gold’s best year since 1979.
The journey was defined by relentless momentum: more than 50 new all-time highs throughout the year, breaching $3,000 in May, $4,000 in October, and finally $4,500 in December. Gold did not merely outperform equities (the S&P 500 rose a modest 18%) but eclipsed every major asset class. This "perfect storm" was fueled by record central bank accumulation, a weakening U.S. dollar, Trump-led trade frictions, and a global flight from overvalued bonds and stocks.
Central Banks: The ‘De-Dollarization’ Pillar
The primary engine behind gold’s ascent was the unwavering appetite of global central banks. For the fourth consecutive year, official sector net purchases exceeded 1,000 tons - more than double the pre-2022 historical average.
In the first half of 2025 alone, central banks acquired 410 tons, up 24% from the five-year average. Emerging markets, led by China, India, Turkey, Russia, and the Gulf states, spearheaded the move. "The current wave of central bank buying is distinct because it is rooted in geopolitics," said Ole Hansen, Head of Commodity Strategy at Saxo Bank. "The freezing of sovereign reserves and the fragmentation of the global financial system have introduced a structural element to gold demand."
J.P. Morgan projects central bank demand to remain elevated at 755 tons in 2026. While lower than the recent 1,000-ton peaks, the higher price floor means banks achieve their desired reserve allocations with fewer physical tons.
Western Investors: The Great Return
After years of under-allocation, Western investors returned en masse in 2025. Physically backed Gold ETFs recorded their largest monthly inflow in September, leading to a record-breaking $26 billion quarter.
The catalyst for this shift included the Federal Reserve’s continued rate-cutting cycle and fears of a "bubble" in equity markets. Gold’s share of global financial assets rose to approximately 2.8% in Q3 2025. "As investors realized the scale of fiscal and geopolitical risks, they pivoted toward gold as the ultimate insurance policy," noted Matt Maley, Chief Market Strategist at Miller Tabak + Co.
The China-India Engine
In China, despite high local prices, investment demand remained robust. A 2025 pilot program allowing 10 insurance companies to allocate up to 1% of assets to gold provided a new institutional tailwind.
In India, asset managers increased exposure despite record local prices reaching near ₹13,893 per gram. Local futures traded around ₹138,000–138,500 per 10 grams, highlighting that the $4,500 rally is a global phenomenon affecting local currencies from Pakistan to the Philippines.
Trump’s Trade War and the Dollar’s Retreat
The second Trump administration’s "Liberation Day" tariffs in April 2025 injected unprecedented uncertainty into global trade. Threats to the Federal Reserve’s independence further enhanced gold’s appeal as a hedge against political interference.
The ensuing trade frictions weighed on the U.S. dollar, providing a powerful tailwind. "We believe the trends driving this shift are far from exhausted," said Natasha Kaneva of J.P. Morgan. "The long-term trend of official and investor diversification has room to run, potentially driving prices toward $5,000 per ounce by late 2026."
Geopolitics and Explosive Debt
With the Russia-Ukraine war entering its fourth year and tensions peaking in the Middle East, gold’s "safe haven" status was reaffirmed. CNN Business noted the parallels to the Carter era: "Today, tariffs are distorting trade, conflict rages in Europe, and the U.S. is seizing tankers off the coast of Venezuela."
Furthermore, the U.S. federal debt exceeding $36 trillion (over 120% of GDP) has created a "term premium" for government bonds, making gold - an asset that cannot be printed - increasingly attractive as a store of value against potential currency debasement.
Reference Data Tables
Table 1: Monthly Gold Price Evolution (2025)
| Month | Price ($/oz) | Monthly Change | Key Events |
| Jan | 2,640 | -- | Year begins with cautious optimism |
| Feb | 2,780 | +5.3% | Rally starts; CB buying intensifies |
| Mar | 2,920 | +5.0% | Fed rate cuts commence |
| Apr | 3,150 | +7.9% | "Liberation Day" - Trump Tariffs |
| May | 3,420 | +8.6% | Breach of $3,000 level; New All-time High |
| Jun | 3,680 | +7.6% | Dollar weakness persists |
| Jul | 3,850 | +4.6% | Temporary lull in CB buying |
| Aug | 3,920 | +1.8% | Relative stabilization |
| Sep | 4,180 | +6.6% | Record monthly ETF inflows |
| Oct | 4,300 | +2.9% | Breach of $4,000; Geopolitical spikes |
| Nov | 4,450 | +3.5% | 50th All-time High of the year |
| Dec | 4,561 | +2.5% | Year closes at record peak |
| Annual | +$1,921 | +73% | Best year since 1979 |
Table 2: Central Bank Gold Purchases (2022-2026)
| Year | Quantity (Tons) | Change vs Historical Avg | Share of Total Demand |
| 2015-2019 (Avg) | 450 | -- | 12% |
| 2022 | 1,082 | +140% | 22% |
| 2023 | 1,037 | +130% | 23% |
| 2024 | 1,045 | +132% | 25% |
| 2025 (H1) | 410 | +24% (vs 5Y Avg) | -- |
| 2026 (Proj) | 755 | +68% | ~20% |
Table 3: Asset Class Performance Comparison (2025)
| Asset | Opening Price | Closing Price | Annual Performance | Rank |
| Platinum | $1,010/oz | $2,478/oz | +172% | 1 |
| Silver | $29/oz | $78/oz | +169% | 2 |
| Gold | $2,640/oz | $4,561/oz | +73% | 3 |
| Copper | $8,500/ton | $11,985/ton | +41% | 4 |
| S&P 500 | -- | -- | +18% | 5 |
| Natural Gas | $3.64/MMBtu | $3.94/MMBtu | +8.2% | 6 |
| Brent Crude | $76.22/bbl | $61.50/bbl | -19.3% | 7 |
Table 4: Gold Price Forecasts (2026-2027)
| Institution | Q4 2026 Target | 2027 Projection | Methodology |
| J.P. Morgan | $5,055/oz | $5,400/oz | CB Demand + Dollar Weakness |
| Goldman Sachs | ~$5,000/oz | -- | Fed politicization scenario |
| World Bank | Record Highs | -- | Sustained Haven Demand |
| State Street | $4,000-$5,000 | -- | Consolidation then breakout |
| Average | ~$4,800 | ~$5,400 | -- |
Table 5: Gold ETF Demand (2022-2026)
| Period | Inflows (Tons) | Value ($B) | Notes |
| 2022-2023 | Outflows | -- | High interest rate environment |
| 2024 | ~10 | -- | Pivot begins |
| Q3 2025 | -- | $26B | Strongest quarter on record |
| Sept 2025 | -- | -- | Largest monthly inflow in history |
| 2026 (Proj) | 250 | -- | Sustained momentum |
Table 6: Gold in Local Currencies (Dec 31, 2025)
| Region | Currency | Price (24k) | Annual Change |
| USA | USD | $4,561/oz | +73% |
| India | INR | ₹13,893/gram | All-time High |
| Pakistan | PKR | Rs 472,862/tola | All-time High |
| Philippines | PHP | ₱8,487/gram | All-time High |
| Eurozone | EUR | €4,100+/oz | All-time High |
Statistical Summary: Gold in 2025
-
Opening Price: $2,640/oz
-
Closing Price: $4,561/oz
-
Annual Performance: +73% (Best since 1979)
-
All-Time Highs reached: 50+
-
H1 Central Bank Buying: 410 tons
-
Q3 ETF Inflows: $26 Billion (Record)
-
Global Asset Share: 2.8%
-
2026 Projected ETF Inflows: 250 tons
-
2026 Projected Bar/Coin Demand: 1,200+ tons
-
Q4 2026 Price Forecast (Avg): ~$4,800 - $5,000
© 2025 EcoPulse24. All Rights Reserved.
Sources & References
Editorial Note
Disclaimer
Please review the Terms & Conditions.
© 2025 EcoPulse24. All rights reserved.