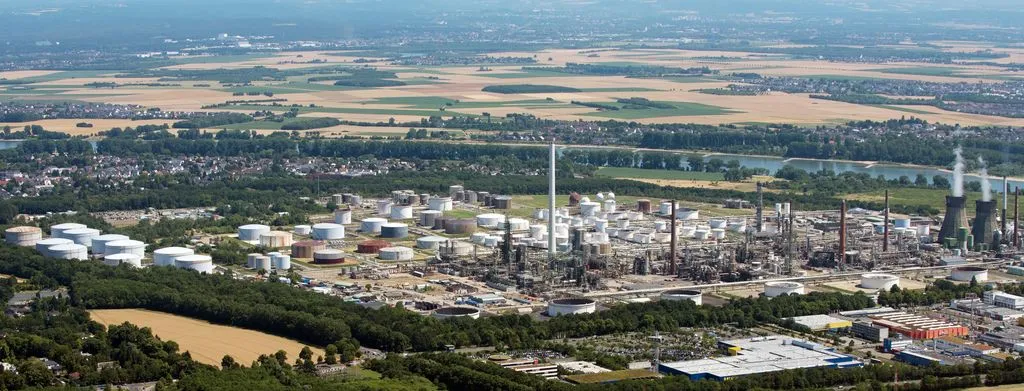
British energy giant reveals hundreds of millions in tax challenges and declining trading margins ahead of official results announcement
By: Economic Editorial Team | EcoPulse24
Date: January 8, 2026
Executive Summary
Shell plc revealed its fourth quarter 2025 outlook today, Wednesday, in a pre-emptive move weeks before the official results announcement scheduled for February 5, 2026, signaling significant pressure on the Chemicals and Products segment, which is expected to record below break-even performance for the first time in several quarters.
The update reveals multifaceted challenges facing the British energy giant, with particular weakness in chemicals, substantial non-cash tax adjustments affecting reported earnings, and significant environmental compliance costs totaling over $2.7 billion in a single quarter.
Chemicals Segment: Significant Losses and Non-Cash Tax Adjustments
Shell's Chemicals division faces its worst performance in recent periods, with the company's quarterly outlook report stating that "the Chemicals sub-segment adjusted earnings are expected to be a significant loss, reflecting a (non-cash) deferred tax adjustment in a joint venture."
Key Segment Details:
| Metric | Q3 2025 | Q4 2025 Outlook | Change |
|---|---|---|---|
| Refining Margin | $12/bbl | $14/bbl | ↑ $2/bbl |
| Chemicals Margin | $160/tonne | $140/tonne | ↓ $20/tonne |
| Refinery Utilization | 96% | 93% - 97% | Stable |
| Chemicals Utilization | 80% | 75% - 79% | ↓ 1-5% |
| Underlying Opex | $2.1B | $1.9B - $2.3B | - |
| Pre-tax Depreciation | $0.9B | $0.7B - $0.9B | - |
| Taxation Charge | $0.3B | $0.2B - $0.6B | - |
Analysis:
The decline in chemicals margin from $160 to $140 per tonne reflects ongoing pressure on this vital segment amid:
- Slowing global demand from China and Europe
- Increased supply of petrochemical products from new Middle Eastern capacity
- Structural overcapacity in global petrochemicals markets
- Weak demand for plastics and other chemical derivatives
The outlook explicitly warns: "The Chemicals & Products segment adjusted earnings is expected to be below break-even in Q4'25. Trading & Optimisation is expected to be significantly lower than Q3'25."
Marketing: Tax Impacts Pressure Earnings
In the Marketing segment, Shell warned that "adjusted earnings are expected to be below Q4'24, reflecting a (non-cash) deferred tax adjustment in a joint venture." This development comes despite relatively stable operational performance.
Marketing Segment Indicators:
- Sales Volumes: 2,650 - 2,750 kb/d (seasonally lower vs. 2,824 kb/d in Q3)
- Underlying Opex: $2.3B - $2.7B
- Pre-tax Depreciation: $0.5B - $0.7B
- Taxation Charge: $0.2B - $0.5B
The seasonal decline in sales volumes is typical for Q4, but the tax adjustment impact on earnings represents an unexpected headwind for the segment's reported profitability.
Trading & Optimization: Sharp Decline Expected
The outlook revealed "significantly lower" expected Trading & Optimization performance compared to Q3 2025 in the Chemicals and Products segment. This decline indicates:
- Challenges in commodity markets volatility
- Reduced arbitrage opportunities in petroleum products
- Price compression in chemical products trading
- Market timing issues affecting optimization activities
This sharp expected decline in T&O performance adds to the segment's challenges, as trading typically provides a buffer during periods of weak underlying margins.
Integrated Gas and Production: Relatively Stable Performance
Integrated Gas Segment
In contrast to Chemicals, the Integrated Gas segment shows better stability, with "Trading & Optimisation expected to be in line with Q3'25."
Key Metrics:
- Production: 930 - 970 kboe/d (vs. 934 kboe/d in Q3)
- LNG Liquefaction Volumes: 7.5 - 7.9 MT (vs. 7.3 MT in Q3)
- Underlying Opex: $1.2B - $1.4B (vs. $1.1B in Q3)
- Pre-tax Depreciation: $1.4B - $1.8B (vs. $1.6B in Q3)
- Taxation Charge: $0.6B - $0.9B (vs. $0.5B in Q3)
The increase in LNG liquefaction volumes reflects strong global demand for natural gas, particularly in Asia and Europe, and Shell's ability to capture value from its integrated gas portfolio.
Upstream Segment
For the Upstream segment, the company expects production levels ranging between 1,840 and 1,940 thousand barrels of oil equivalent per day, including the impact of incorporating the Adura joint venture in the United Kingdom.
Key Metrics:
- Production: 1,840 - 1,940 kboe/d (vs. 1,832 kboe/d in Q3)
- Underlying Opex: $2.1B - $2.7B (vs. $2.2B in Q3)
- Pre-tax Depreciation: $2.4B - $3.0B (vs. $2.7B in Q3)
- Taxation Charge: $1.4B - $2.2B (vs. $1.9B in Q3)
The production guidance includes the impact of the newly incorporated Adura JV, with the outlook noting: "With the formation of the incorporated Adura JV (UK Upstream), future cash flows will be in the form of dividends, with timing determined by the JV."
Strategic Restructuring: Canadian Oil Sands Exit
In a significant strategic move, Shell announced the completion of the Canadian oil sands swap, with production levels in this sector declining to approximately 20 thousand barrels of oil equivalent per day in Q4 2025.
Impact of the Oil Sands Exit:
Production Impact:
- Dramatic reduction from previous high levels to ~20 kboe/d
- Effectively an exit from major oil sands operations
- Part of broader portfolio rationalization strategy
Financial Impact: The outlook states: "Following the swap of Canadian oil sands, there will be a reduction in Chemicals and Products Adjusted Earnings with a corresponding reduction in non-controlling interest for 50% at a Shell Group level."
Strategic Rationale: This shift signals a clear strategic transformation toward:
- Less carbon-intensive assets
- More profitable operations
- Portfolio alignment with net-zero commitments
- Focus on higher-value, lower-emission assets
The Canadian oil sands have long been criticized for their high carbon intensity and environmental impact. This exit, while reducing short-term production, positions Shell for a more sustainable long-term portfolio.
Cash Flows: Environmental and Tax Burdens
On the cash flow from operations front, Shell warned of substantial outflows related to environmental compliance and taxes.
Major Cash Flow Items:
CFFO Outlook (Q4 2025):
-
Tax Paid: $2.3B - $3.1B
-
Financial Derivative Instruments: ($2B) - $2B range
-
Other: ($4B) - ($1B), including:
- ~$1.5 billion outflow for German BEHG emissions certificates
- The outlook notes: "CFFO excluding working capital is expected to include an ~$1.5 billion outflow related to timing of payments of emissions certificates relating to the German BEHG (Brennstoffemissionshandelsgesetz - Fuel Emissions Trading Act)."
-
Working Capital: ($3B) - $1B, including:
- ~$1.2 billion for German Mineral Oil Taxes
- The outlook states: "Q4'25 Working Capital movements is expected to include the typical ~$1.2 billion payment of German Mineral Oil Taxes."
Analysis of Cash Flow Impact:
The combined burden of emissions certificates ($1.5B) and mineral oil taxes ($1.2B) totaling $2.7 billion represents a substantial cash outflow in a single quarter, highlighting:
- Regulatory Burden: Increasing cost of environmental compliance in Europe
- Germany-Specific Issues: Concentrated exposure to German environmental regulations
- Cash Flow Volatility: Timing of these payments creates quarterly volatility
- Long-term Trend: These costs likely to increase as climate regulations tighten
This environmental compliance burden effectively represents a significant "carbon tax" that energy companies face, particularly in European markets.
Renewables and Energy Solutions: Expected Volatility
For the Renewables and Energy Solutions segment, Shell expects adjusted earnings ranging between a loss of $0.2 billion and a gain of $0.2 billion, compared to a profit of $0.1 billion in Q3.
Analysis:
This wide $400 million range reflects:
- Ongoing uncertainty in renewable energy markets
- Project development timing variability
- Market volatility in renewable energy prices
- Early-stage nature of many investments
- Integration challenges in the energy transition
The potential swing from profit to loss demonstrates the segment remains in transition, with profitability not yet established consistently.
Corporate Segment: Continued Losses
The Corporate segment is expected to record adjusted earnings of ($0.6B) - ($0.4B), compared to ($0.4B) in Q3, representing ongoing corporate overhead costs.
Analysis: What These Numbers Mean
Shell's Q4 2025 outlook reveals multifaceted challenges facing the British energy giant:
1. Structural Pressures on Petrochemicals
The structural pressures on the chemicals segment reflect broader challenges in the global petrochemical industry:
Supply-Side Issues:
- Massive new capacity additions in China (ethylene, propylene complexes)
- Middle Eastern expansion (Saudi Aramco, ADNOC, Qatar Energy petrochemical investments)
- Structural overcapacity globally
Demand-Side Challenges:
- Chinese economic slowdown reducing plastics demand
- European industrial weakness
- Destocking in supply chains
- Shift away from single-use plastics
Competitive Disadvantages:
- Middle Eastern producers have feedstock cost advantages
- Asian producers have proximity to growing markets
- European producers face higher energy and compliance costs
The decline in chemicals margin from $160 to $140 per tonne represents a 12.5% erosion, with potential for further compression.
2. Non-Cash Tax Adjustments Impact
The deferred tax adjustments, despite being non-cash and not affecting actual liquidity, significantly impact reported earnings:
Direct Impact:
- ~$0.3 billion total deferred tax impact across Marketing and Chemicals JVs
- Split roughly equally between the two segments
- Reduces reported adjusted earnings without cash effect
Investor Perception Issues:
- Reported earnings are what investors see first
- Non-cash charges still affect P&L and EPS
- May negatively impact stock price despite no cash impact
- Complicates earnings quality assessment
Accounting Context: The outlook notes: "The taxation charge across segments includes the annual (non-cash) reassessment of deferred tax assets. The deferred tax impact on Joint Ventures and Associates in Marketing and Chemicals is expected to be ~$0.3 billion split roughly equally."
3. Strategic Transformation
The Canadian oil sands exit signals a clear strategic shift:
Portfolio Optimization:
- Moving away from high-carbon assets
- Focusing on more profitable operations
- Reducing regulatory and reputational risk
- Aligning with net-zero commitments by 2050
Short-term Pain for Long-term Gain:
- Production decline from exit (~20 kboe/d remaining)
- Earnings reduction in short term
- But positions company for sustainable future
- Reduces carbon intensity of portfolio
Precedent and Pattern: This exit follows previous divestments and signals ongoing portfolio rationalization, with Shell likely to continue shedding higher-carbon, lower-return assets.
4. Rising Environmental Compliance Costs
The financial burdens associated with emissions certificates ($1.5B) and environmental taxes ($1.2B) highlight increasing costs:
Current Burden:
- Over $2.7 billion in Q4 2025 alone
- Concentrated in European operations (Germany)
- Creates significant cash flow volatility
Future Trajectory:
- EU ETS carbon prices likely to rise
- More stringent climate regulations coming
- Expansion of carbon pricing mechanisms
- Global adoption of similar schemes
Strategic Implications:
- Accelerates business case for low-carbon investments
- Disadvantages European vs. Middle Eastern operations
- Creates pressure for further portfolio transformation
- May drive investment reallocation geographically
5. Bright Spots: Integrated Gas Stability
The relatively stable performance in Integrated Gas provides some balance:
Strengths:
- LNG volumes increasing (7.5-7.9 MT vs. 7.3 MT)
- Trading & Optimization in line with Q3
- Strong global LNG demand fundamentals
- Portfolio integration benefits
Market Context:
- European gas demand robust for heating/power
- Asian LNG demand growing (China, India)
- LNG pricing relatively favorable
- Shell's integrated position provides competitive advantage
Broader Context: Global Energy Sector Challenges
Shell's outlook comes amid broader challenges facing the global energy sector at the end of 2025:
Global Oil Markets
Supply Pressures:
- U.S. shale production continuing to grow
- OPEC+ production discipline uncertain
- Non-OPEC supply increasing
- Spare capacity concerns diminishing
Demand Challenges:
- China economic slowdown (world's largest oil importer)
- European industrial weakness
- Electric vehicle adoption accelerating
- Energy efficiency improvements
Petrochemicals Crisis
The global petrochemical sector suffers from structural issues:
Massive Overcapacity:
- New plants in China (ethylene crackers, polyethylene/polypropylene units)
- Middle Eastern expansions (Saudi Arabia, UAE, Qatar)
- Southeast Asian capacity additions
- Global utilization rates declining
Price Wars:
- Producers fighting for market share
- Margin compression across the value chain
- Unsustainable pricing in some markets
- Weak demand exacerbating oversupply
Regional Disadvantages:
- European producers highest cost globally
- Feedstock disadvantage vs. Middle East
- Regulatory burden in Europe higher
- Energy costs elevated in Europe
Energy Transition and Its Costs
Increasing regulatory pressure in Europe to reduce emissions:
EU Emissions Trading System (ETS):
- Carbon prices elevated and rising
- Expanded scope of regulations
- More stringent caps coming
- Free allocation being phased out
National Regulations:
- Germany's BEHG (Fuel Emissions Trading Act)
- UK carbon pricing mechanisms
- Various national climate laws
- Compliance costs accelerating
Transition Costs:
- Investment in low-carbon technologies
- Existing asset write-downs
- Regulatory compliance expenses
- Reputational and ESG pressures
Middle East Competition
National oil companies in the Gulf have significant advantages:
Competitive Advantages:
- Low-cost feedstock (oil, gas, NGLs)
- State support and long-term planning
- Proximity to growing Asian markets
- Lower regulatory burden initially
Strategic Expansions:
- Saudi Aramco petrochemical investments
- ADNOC downstream integration
- Qatar Energy LNG and petrochemicals
- Aggressive capacity additions
This competition puts structural pressure on Western integrated companies like Shell, particularly in petrochemicals.
What's Next?
Key Dates:
- January 28, 2026: Vara Research consensus publication
- February 5, 2026: Official Q4 2025 results announcement
What Investors Will Watch:
-
Ability to Offset Weakness: Can Shell offset chemicals weakness through stronger LNG and upstream performance?
-
Tax Adjustment Details: Further clarification on the nature of deferred tax adjustments and future impact.
-
Restructuring Strategy: More details on portfolio reshaping plans and potential further divestments.
-
Dividend Policy: Will Shell maintain its shareholder returns policy despite challenges?
-
2026 Guidance: Forward outlook and capital investment plans.
-
Chemicals Strategy: Plans to address structural issues in the segment - further rationalization?
-
Energy Transition Progress: Updates on low-carbon investments and net-zero pathway.
-
Cash Flow Sustainability: How to manage growing environmental compliance costs.
Analyst Focus Areas:
- Underlying cash generation capability
- Capital allocation priorities
- Portfolio transformation pace
- Chemicals segment future (hold vs. divest?)
- LNG expansion plans and economics
- Upstream production growth trajectory
- Renewables profitability pathway
Conclusion
Shell's Q4 2025 outlook reveals a company navigating significant headwinds in key segments, particularly Chemicals and Products, while maintaining more stable performance in Integrated Gas.
Key Takeaways:
Challenges:
- Significant expected losses in Chemicals segment (below break-even)
- Non-cash tax adjustments reducing reported earnings by ~$0.3B
- Sharp decline in Trading & Optimization expected
- Over $2.7B in environmental and tax burdens in single quarter
- Structural overcapacity in global petrochemicals
Bright Spots:
- Relative stability in Integrated Gas segment
- LNG volumes increasing (7.5-7.9 MT vs. 7.3 MT)
- Refining margins improving slightly ($12 to $14/bbl)
- Upstream production stable with Adura JV incorporation
Strategic Transformations:
- Canadian oil sands exit (down to ~20 kboe/d)
- Adura JV formation in UK Upstream
- Portfolio reshaping toward lower-carbon assets
- Alignment with net-zero commitments
Financial Impact:
- Reported earnings will be pressured by non-cash tax items
- Cash flow facing significant environmental compliance costs
- Portfolio changes reducing near-term production/earnings
- But positioning for more sustainable long-term business model
Outlook Assessment:
The strategic decisions - such as the Canadian oil sands exit and formation of new joint ventures - indicate Shell is actively reshaping its portfolio toward more profitable and less carbon-intensive assets, attempting to adapt to the changing energy landscape and increasing environmental commitments.
Despite short-term challenges, Shell continues executing its energy transition strategy, bearing transitional costs in pursuit of building a more sustainable business model for the long term. The company faces a difficult balancing act:
- Maintaining returns to shareholders
- Investing in energy transition
- Managing legacy asset challenges
- Adapting to changing regulatory environment
The Q4 outlook suggests this balancing act remains challenging, with headwinds in traditional businesses (particularly petrochemicals) requiring continued portfolio transformation and operational excellence in stronger segments (particularly LNG) to maintain overall performance.
Key Figures at a Glance
| Segment | Key Metric | Q3 2025 | Q4 2025 Outlook |
|---|---|---|---|
| Integrated Gas | Production | 934 kboe/d | 930-970 kboe/d |
| LNG Liquefaction | 7.3 MT | 7.5-7.9 MT | |
| Underlying Opex | $1.1B | $1.2B-$1.4B | |
| Upstream | Production | 1,832 kboe/d | 1,840-1,940 kboe/d |
| Underlying Opex | $2.2B | $2.1B-$2.7B | |
| Marketing | Sales Volumes | 2,824 kb/d | 2,650-2,750 kb/d |
| Underlying Opex | $2.7B | $2.3B-$2.7B | |
| Chemicals & Products | Refining Margin | $12/bbl | $14/bbl |
| Chemicals Margin | $160/tonne | $140/tonne | |
| Refinery Utilization | 96% | 93-97% | |
| Chemicals Utilization | 80% | 75-79% | |
| Renewables | Adjusted Earnings | $0.1B | ($0.2B)-$0.2B |
| Corporate | Adjusted Earnings | ($0.4B) | ($0.6B)-($0.4B) |
| Group Cash Flow | BEHG Payment | - | ~$1.5B outflow |
| German Mineral Tax | - | ~$1.2B payment | |
| Oil Sands | Production | Higher | ~20 kboe/d |
About This Analysis
This analysis is based on Shell plc's Fourth Quarter 2025 Update Note released on January 8, 2026. All figures and outlooks are from Shell's official disclosure. The analysis and commentary represent EcoPulse24's independent assessment of the disclosed information and broader industry context.
Disclaimer: This article is for informational purposes only and should not be considered investment advice. Readers should conduct their own research and consult with financial advisors before making investment decisions.
© 2026 EcoPulse24 | All Rights Reserved
For media inquiries: info@ecopulse24.com
Source: Shell plc - Q4 2025 Update Note, January 8, 2026